Overview
Part 1 looks at some principles and introduces some of the tools in your arsenal.
Part 2 covers the dreaded PostgreSQL bloat issue as well as how TOAST can help performance, or hinder it.
Part 3 dives deeper into identifying, investigating and mitigating slow queries.
Part 4 covers indexes.
Part 5 (this post) covers rewriting queries.
TL;DR
- Break your query down using CTEs
- Optimise each step
- Rewrite using what you’ve learned (if you want to)
- Visualising an explain plan can really make problems obvious, compared to sifting through a sea of text
Rewriting queries
bench=# \d pgbench_accounts
              Table "public.pgbench_accounts"
  Column  |     Type      | Collation | Nullable | Default
----------+---------------+-----------+----------+---------
 aid      | integer       |           | not null |
 bid      | integer       |           |          |
 abalance | integer       |           |          |
 filler   | character(84) |           |          |
Indexes:
    "pgbench_accounts_pkey" PRIMARY KEY, btree (aid)
    "i_pa2" btree (aid, abalance, bid) WHERE aid > 0 AND aid < 194999 AND abalance < '-4500'::integer AND abalance > '-5000'::integer
Foreign-key constraints:
    "pgbench_accounts_bid_fkey" FOREIGN KEY (bid) REFERENCES pgbench_branches(bid)
Referenced by:
    TABLE "pgbench_history" CONSTRAINT "pgbench_history_aid_fkey" FOREIGN KEY (aid) REFERENCES pgbench_accounts(aid)

bench=# \d pgbench_branches
              Table "public.pgbench_branches"
  Column  |     Type      | Collation | Nullable | Default
----------+---------------+-----------+----------+---------
 bid      | integer       |           | not null |
 bbalance | integer       |           |          |
 filler   | character(88) |           |          |
Indexes:
    "pgbench_branches_pkey" PRIMARY KEY, btree (bid)
Referenced by:
    TABLE "pgbench_accounts" CONSTRAINT "pgbench_accounts_bid_fkey" FOREIGN KEY (bid) REFERENCES pgbench_branches(bid)
    TABLE "pgbench_history" CONSTRAINT "pgbench_history_bid_fkey" FOREIGN KEY (bid) REFERENCES pgbench_branches(bid)
    TABLE "pgbench_tellers" CONSTRAINT "pgbench_tellers_bid_fkey" FOREIGN KEY (bid) REFERENCES pgbench_branches(bid)

bench=# \d pgbench_history
                    Table "public.pgbench_history"
 Column |            Type             | Collation | Nullable | Default
--------+-----------------------------+-----------+----------+---------
 tid    | integer                     |           |          |
 bid    | integer                     |           |          |
 aid    | integer                     |           |          |
 delta  | integer                     |           |          |
 mtime  | timestamp without time zone |           |          |
 filler | character(22)               |           |          |
Indexes:
    "i1" btree (aid, delta) WHERE delta < 0
Foreign-key constraints:
    "pgbench_history_aid_fkey" FOREIGN KEY (aid) REFERENCES pgbench_accounts(aid)
    "pgbench_history_bid_fkey" FOREIGN KEY (bid) REFERENCES pgbench_branches(bid)
    "pgbench_history_tid_fkey" FOREIGN KEY (tid) REFERENCES pgbench_tellers(tid)

bench=# \d pgbench_tellers
              Table "public.pgbench_tellers"
  Column  |     Type      | Collation | Nullable | Default
----------+---------------+-----------+----------+---------
 tid      | integer       |           | not null |
 bid      | integer       |           |          |
 tbalance | integer       |           |          |
 filler   | character(84) |           |          |
Indexes:
    "pgbench_tellers_pkey" PRIMARY KEY, btree (tid)
Foreign-key constraints:
    "pgbench_tellers_bid_fkey" FOREIGN KEY (bid) REFERENCES pgbench_branches(bid)
Referenced by:
    TABLE "pgbench_history" CONSTRAINT "pgbench_history_tid_fkey" FOREIGN KEY (tid) REFERENCES pgbench_tellers(tid)
Joins
We have already covered one aspect of query rewriting, namely how to rewrite joins, which we covered in Query Performance Improvement Part 3.
Common Table Expressions
Another useful technique is to use Common Table Expressions, or CTEs, to break a complex query down to manageable chunks that allows you to optimise the performance of each “chunk”.
Let us assume a requirement for the following: we want to know the account aid, the teller tid and bid, the history deltas, the branch bbalance, and the teller tbalance where the history mtime is in a certain range, the account bid is the same as the teller bid, the teller tbalance is a negative amount and the branch bbalance is a negative amount.
SELECT a.aid, t.tid, t.bid, h.delta, b.bbalance, t.tbalance
FROM pgbench_accounts a, pgbench_branches b, pgbench_history h, pgbench_tellers t
WHERE a.bid IN (SELECT bid FROM pgbench_branches where bbalance < 0)
AND a.bid IN (SELECT bid FROM pgbench_tellers where tbalance < 0)
AND a.aid IN (SELECT aid FROM pgbench_history WHERE mtime > '2024-08-27 09:43:00' AND mtime < '2024-08-27 09:44:00');
The first line of the explain plan already tells us this is a bad query:
EXPLAIN (COSTS, SETTINGS, VERBOSE)
SELECT a.aid, t.tid, t.bid, h.delta, b.bbalance, t.tbalance
FROM pgbench_accounts a, pgbench_branches b, pgbench_history h, pgbench_tellers t
WHERE a.bid IN (SELECT bid FROM pgbench_branches where bbalance < 0)
AND a.bid IN (SELECT bid FROM pgbench_tellers where tbalance < 0)
AND a.aid IN (SELECT aid FROM pgbench_history WHERE mtime > '2024-08-27 09:43:00' AND mtime < '2024-08-27 09:44:00');

 Hash Join  (cost=258830229.06..9464630930.54 rows=4854182151200000 width=24)
It looks very much like there are a number of sequential scans and a Cartesian product of all the rows in the table. Let’s investigate:
bench=# SELECT count(*) FROM pgbench_accounts;
  count
----------
 10000000
(1 row)

Time: 3507.838 ms (00:03.508)
bench=# SELECT count(*) FROM pgbench_branches;
 count
-------
   100
(1 row)

Time: 5.163 ms
bench=# SELECT count(*) FROM pgbench_branches where bbalance < 0;
 count
-------
    53
(1 row)

Time: 3.599 ms
bench=# SELECT count(*) FROM pgbench_tellers;
 count
-------
  1000
(1 row)

Time: 62.356 ms
bench=# SELECT count(*) FROM pgbench_tellers where tbalance < 0;
 count
-------
   489
(1 row)

Time: 6.067 ms
bench=# SELECT count(*) FROM pgbench_history;
 count
--------
 446456
(1 row)

Time: 60.284 ms
bench=# SELECT count(*) FROM pgbench_history;
 count
--------
 446456
(1 row)

Time: 47.074 ms
bench=# SELECT count(*) FROM pgbench_history where  mtime > '2024-08-27 09:43:00' AND mtime < '2024-08-27 09:44:00';
 count
--------
 209074
(1 row)

Time: 80.440 ms
As you can see, each of the subqueries returns around half the total data set, so we are almost certainly not going to fix this with indexes, as the optimiser is probably still going to scan the table. But also, we can see that the individual subqueries are not egregiously slow.
Part of the problem is almost certainly the lack of joins. Let’s address that:
SELECT a.aid, t.tid, t.bid, h.delta, b.bbalance, t.tbalance
FROM pgbench_accounts a, pgbench_branches b, pgbench_history h, pgbench_tellers t
WHERE a.bid IN (SELECT bid FROM pgbench_branches where bbalance < 0)
AND a.bid IN (SELECT bid FROM pgbench_tellers where tbalance < 0)
AND a.aid IN (SELECT aid FROM pgbench_history WHERE mtime > '2024-08-27 09:43:00' AND mtime < '2024-08-27 09:44:00')
AND a.bid = b.bid
AND a.aid = h.aid
AND h.tid = t.tid;
Let’s examine this query plan more closely:
 Hash Join  (cost=233738.96..242057.11 rows=4854 width=24) (actual time=4644.826..4919.191 rows=114232 loops=1)
   Output: a.aid, t.tid, t.bid, h.delta, b.bbalance, t.tbalance
   Inner Unique: true
   Hash Cond: (a.bid = pgbench_tellers.bid)
   Buffers: shared hit=16257 read=162733
   ->  Nested Loop  (cost=232873.00..241124.41 rows=4854 width=36) (actual time=4640.138..4890.941 rows=114232 loops=1)
         Output: a.aid, a.bid, b.bbalance, b.bid, h.delta, t.tid, t.bid, t.tbalance, pgbench_branches.bid
         Inner Unique: true
         Buffers: shared hit=15407 read=162733
         ->  Nested Loop  (cost=232872.71..240702.05 rows=4854 width=28) (actual time=4640.120..4835.404 rows=114232 loops=1)
               Output: a.aid, a.bid, b.bbalance, b.bid, h.delta, h.tid, pgbench_branches.bid
               Inner Unique: true
               Buffers: shared hit=12407 read=162733
               ->  Nested Loop  (cost=232872.43..240552.64 rows=4854 width=20) (actual time=4640.111..4784.723 rows=114232 loops=1)
                     Output: a.aid, a.bid, h.delta, h.tid, pgbench_branches.bid
                     Inner Unique: true
                     Buffers: shared hit=12248 read=162733
                     ->  Gather  (cost=232872.16..240291.58 rows=9335 width=16) (actual time=4640.039..4694.906 rows=214003 loops=1)
                           Output: a.aid, a.bid, h.delta, h.tid
                           Workers Planned: 1
                           Workers Launched: 1
                           Buffers: shared hit=11948 read=162733
                           ->  Parallel Hash Join  (cost=231872.16..238358.08 rows=5491 width=16) (actual time=4625.345..4715.708 rows=107002 loops=2)
                                 Output: a.aid, a.bid, h.delta, h.tid
                                 Hash Cond: (h.aid = a.aid)
                                 Buffers: shared hit=11948 read=162733
                                 Worker 0:  actual time=4611.133..4760.152 rows=211671 loops=1
                                   Buffers: shared hit=6350 read=81406
                                 ->  Parallel Seq Scan on public.pgbench_history h  (cost=0.00..5478.21 rows=262621 width=12) (actual time=0.004..20.180 rows=223228 loops=2)
                                       Output: h.tid, h.bid, h.aid, h.delta, h.mtime, h.filler
                                       Buffers: shared hit=2852
                                       Worker 0:  actual time=0.005..30.901 rows=338335 loops=1
                                         Buffers: shared hit=2161
                                 ->  Parallel Hash  (cost=230783.14..230783.14 rows=87121 width=12) (actual time=4624.451..4624.506 rows=103442 loops=2)
                                       Output: a.aid, a.bid, pgbench_history.aid
                                       Buckets: 262144  Batches: 1  Memory Usage: 11776kB
                                       Buffers: shared hit=9000 read=162733
                                       Worker 0:  actual time=4610.498..4610.500 rows=104160 loops=1
                                         Buffers: shared hit=4093 read=81406
                                       ->  Parallel Hash Semi Join  (cost=8328.76..230783.14 rows=87121 width=12) (actual time=77.852..4590.080 rows=103442 loops=2)
                                             Output: a.aid, a.bid, pgbench_history.aid
                                             Hash Cond: (a.aid = pgbench_history.aid)
                                             Buffers: shared hit=9000 read=162733
                                             Worker 0:  actual time=63.985..4576.054 rows=104160 loops=1
                                               Buffers: shared hit=4093 read=81406
                                             ->  Parallel Seq Scan on public.pgbench_accounts a  (cost=0.00..210547.67 rows=4166667 width=8) (actual time=0.463..3368.711 rows=5000000 loops=2)
                                                   Output: a.aid, a.bid, a.abalance, a.filler
                                                   Buffers: shared hit=6148 read=162733
                                                   Worker 0:  actual time=0.485..3360.014 rows=5005446 loops=1
                                                     Buffers: shared hit=3077 read=81406
                                             ->  Parallel Hash  (cost=6791.32..6791.32 rows=122995 width=4) (actual time=76.627..76.628 rows=104537 loops=2)
                                                   Output: pgbench_history.aid
                                                   Buckets: 262144  Batches: 1  Memory Usage: 10240kB
                                                   Buffers: shared hit=2852
                                                   Worker 0:  actual time=63.221..63.221 rows=98831 loops=1
                                                     Buffers: shared hit=1016
                                                   ->  Parallel Seq Scan on public.pgbench_history  (cost=0.00..6791.32 rows=122995 width=4) (actual time=24.634..53.517 rows=104537 loops=2)
                                                         Output: pgbench_history.aid
                                                         Filter: ((pgbench_history.mtime > '2024-08-27 09:43:00'::timestamp without time zone) AND (pgbench_history.mtime < '2024-08-27 09:44:00'::timestamp without time zone))
                                                         Rows Removed by Filter: 118691
                                                         Buffers: shared hit=2852
                                                         Worker 0:  actual time=11.226..41.186 rows=98831 loops=1
                                                           Buffers: shared hit=1016
                     ->  Memoize  (cost=0.28..0.30 rows=1 width=4) (actual time=0.000..0.000 rows=1 loops=214003)
                           Output: pgbench_branches.bid
                           Cache Key: a.bid
                           Cache Mode: logical
                           Hits: 213903  Misses: 100  Evictions: 0  Overflows: 0  Memory Usage: 9kB
                           Buffers: shared hit=300
                           ->  Index Scan using pgbench_branches_pkey on public.pgbench_branches  (cost=0.27..0.29 rows=1 width=4) (actual time=0.002..0.002 rows=1 loops=100)
                                 Output: pgbench_branches.bid
                                 Index Cond: (pgbench_branches.bid = a.bid)
                                 Filter: (pgbench_branches.bbalance < 0)
                                 Rows Removed by Filter: 0
                                 Buffers: shared hit=300
               ->  Memoize  (cost=0.28..0.30 rows=1 width=8) (actual time=0.000..0.000 rows=1 loops=114232)
                     Output: b.bbalance, b.bid
                     Cache Key: a.bid
                     Cache Mode: logical
                     Hits: 114179  Misses: 53  Evictions: 0  Overflows: 0  Memory Usage: 6kB
                     Buffers: shared hit=159
                     ->  Index Scan using pgbench_branches_pkey on public.pgbench_branches b  (cost=0.27..0.29 rows=1 width=8) (actual time=0.001..0.001 rows=1 loops=53)
                           Output: b.bbalance, b.bid
                           Index Cond: (b.bid = a.bid)
                           Buffers: shared hit=159
         ->  Memoize  (cost=0.29..0.31 rows=1 width=12) (actual time=0.000..0.000 rows=1 loops=114232)
               Output: t.tid, t.bid, t.tbalance
               Cache Key: h.tid
               Cache Mode: logical
               Hits: 113232  Misses: 1000  Evictions: 0  Overflows: 0  Memory Usage: 110kB
               Buffers: shared hit=3000
               ->  Index Scan using pgbench_tellers_pkey on public.pgbench_tellers t  (cost=0.28..0.30 rows=1 width=12) (actual time=0.001..0.001 rows=1 loops=1000)
                     Output: t.tid, t.bid, t.tbalance
                     Index Cond: (t.tid = h.tid)
                     Buffers: shared hit=3000
   ->  Hash  (cost=864.71..864.71 rows=100 width=4) (actual time=4.656..4.657 rows=100 loops=1)
         Output: pgbench_tellers.bid
         Buckets: 1024  Batches: 1  Memory Usage: 12kB
         Buffers: shared hit=850
         ->  HashAggregate  (cost=863.71..864.71 rows=100 width=4) (actual time=4.563..4.595 rows=100 loops=1)
               Output: pgbench_tellers.bid
               Group Key: pgbench_tellers.bid
               Batches: 1  Memory Usage: 24kB
               Buffers: shared hit=850
               ->  Seq Scan on public.pgbench_tellers  (cost=0.00..862.50 rows=484 width=4) (actual time=2.584..4.326 rows=489 loops=1)
                     Output: pgbench_tellers.bid
                     Filter: (pgbench_tellers.tbalance < 0)
                     Rows Removed by Filter: 511
                     Buffers: shared hit=850
 Planning:
   Buffers: shared hit=62
 Planning Time: 7.866 ms
 Execution Time: 4927.560 ms
(113 rows)
As you can see, it’s quite a mouthful! Visualising the query will highlight the problem instantly:
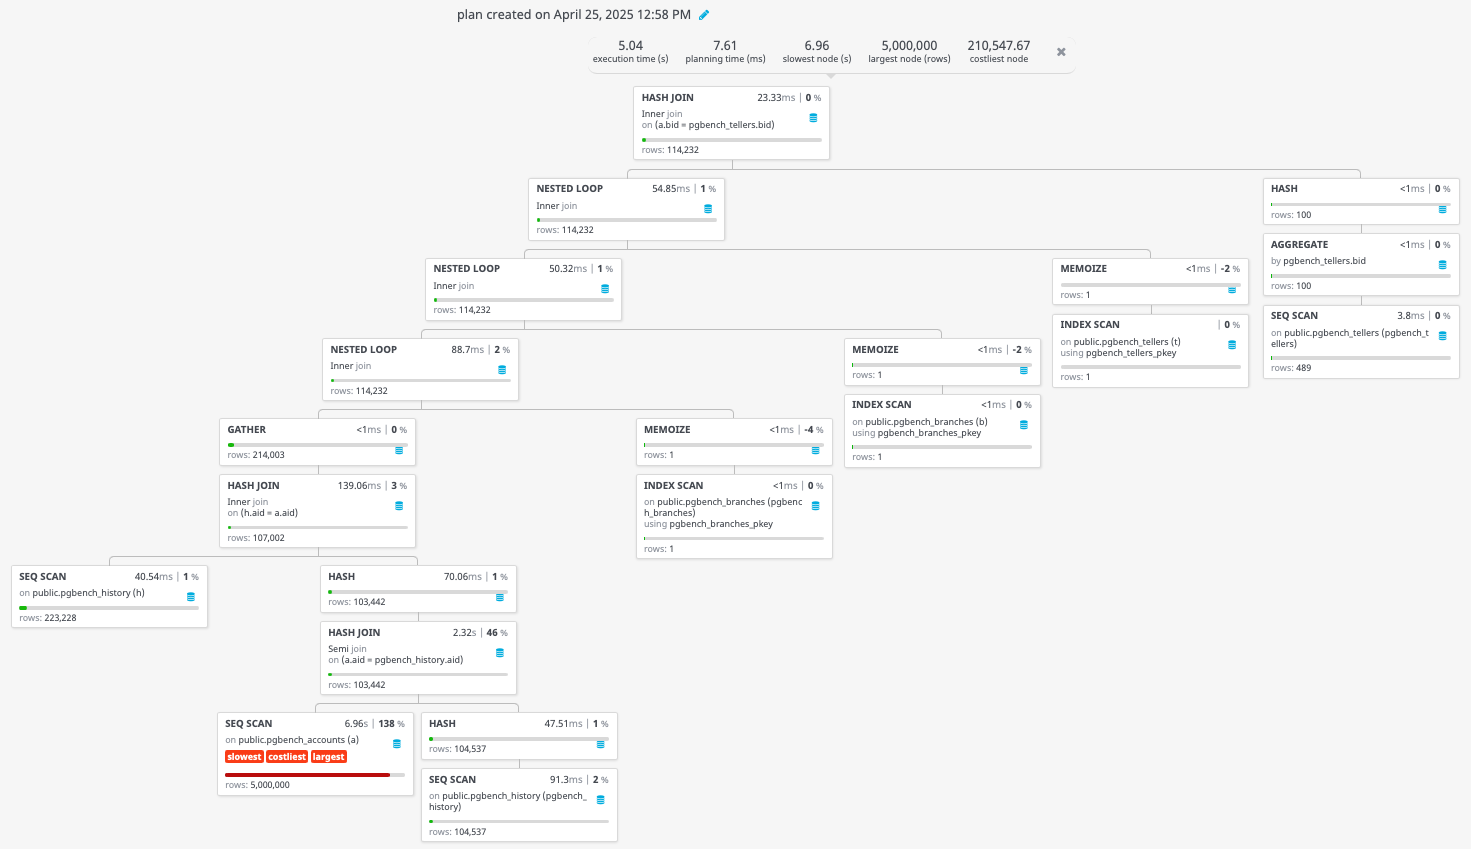
As you can see in the bottom left, there is a sequential scan of the pgbench_accounts table that is taking all the time. The cost of this query is significantly lower:
Hash Join (cost=233738.96..242057.11 rows=4854 width=24) (actual time=5349.504..5648.512 rows=114232 loops=1)
And, indeed, it completes in a reasonable few seconds, where it would have taken days originally (and possibly not given the answer we were expecting. But can we speed it up further?
As a test, I rewrote the queries to build a single CTE to join to the main table and eliminated the largest table from the query, and this runs in a reasonable time:
WITH b AS (SELECT bid, bbalance FROM pgbench_branches where bbalance < 0),
t AS (SELECT bid, tid, tbalance FROM pgbench_tellers where tbalance < 0),
bt AS (SELECT b.bid, t.tid, b.bbalance, t.tbalance FROM b JOIN t ON (b.bid = t.bid))
SELECT h.aid bt.tid, bt.bid, h.delta, bt.bbalance, bt.tbalance
FROM pgbench_history h, bt
WHERE mtime > '2024-08-27 09:43:00' AND mtime < '2024-08-27 09:44:00'
AND h.tid = bt.tid
AND h.bid = bt.bid;

.
.
.
 8714832 | 675 |  68 | -2504 |  -291586 |  -143701
 1173490 | 522 |  53 |   608 |  -367459 |   -28668
  274124 | 981 |  99 | -4105 |  -364659 |  -199574
 5004333 | 392 |  40 |  -214 |  -735005 |  -101075
 7135317 | 990 |  99 |  2235 |  -364659 |  -174671
(498 rows)

Time: 80.044 ms
Let’s add the main table back and join it to the final CTE:
WITH b AS (SELECT bid, bbalance FROM pgbench_branches where bbalance < 0),
t AS (SELECT bid, tid, tbalance FROM pgbench_tellers where tbalance < 0),
bt AS (SELECT b.bid, t.tid, b.bbalance, t.tbalance FROM b JOIN t ON (b.bid = t.bid)),
lkup AS (SELECT h.aid, bt.tid, bt.bid, h.delta, bt.bbalance, bt.tbalance
FROM pgbench_history h, bt
WHERE mtime > '2024-08-27 09:43:00' AND mtime < '2024-08-27 09:44:00'
AND h.tid = bt.tid
AND h.bid = bt.bid)
SELECT a.aid, lkup.*
FROM pgbench_accounts a
JOIN lkup ON (a.aid = lkup.aid);

.
.
.
 8714832 | 8714832 | 675 |  68 | -2504 |  -291586 |  -143701
 1173490 | 1173490 | 522 |  53 |   608 |  -367459 |   -28668
  274124 |  274124 | 981 |  99 | -4105 |  -364659 |  -199574
 5004333 | 5004333 | 392 |  40 |  -214 |  -735005 |  -101075
 8354949 | 8354949 | 389 |  39 |  3748 |  -145450 |  -104172
(498 rows)

Time: 85.912 ms
As you can see, this is “silver bullet” improvement, from over 5 seconds to well under 100ms. The explain plan is also much simpler:
 Gather  (cost=1870.47..10470.96 rows=526 width=28) (actual time=49.107..111.926 rows=498 loops=1)
   Output: a.aid, h.aid, pgbench_tellers.tid, pgbench_branches.bid, h.delta, pgbench_branches.bbalance, pgbench_tellers.tbalance
   Workers Planned: 1
   Workers Launched: 1
   Buffers: shared hit=7562
   ->  Nested Loop  (cost=870.47..9418.36 rows=309 width=28) (actual time=30.778..90.495 rows=249 loops=2)
         Output: a.aid, h.aid, pgbench_tellers.tid, pgbench_branches.bid, h.delta, pgbench_branches.bbalance, pgbench_tellers.tbalance
         Inner Unique: true
         Buffers: shared hit=7562
         Worker 0:  actual time=13.754..73.013 rows=246 loops=1
           Buffers: shared hit=3316
         ->  Nested Loop  (cost=870.04..8353.02 rows=309 width=24) (actual time=30.654..84.543 rows=249 loops=2)
               Output: h.aid, h.delta, pgbench_branches.bid, pgbench_branches.bbalance, pgbench_tellers.tid, pgbench_tellers.tbalance
               Inner Unique: true
               Join Filter: (pgbench_branches.bid = pgbench_tellers.bid)
               Buffers: shared hit=5156
               Worker 0:  actual time=13.566..66.474 rows=246 loops=1
                 Buffers: shared hit=2129
               ->  Hash Join  (cost=869.76..8306.81 rows=595 width=24) (actual time=30.364..83.436 rows=482 loops=2)
                     Output: h.aid, h.delta, h.bid, pgbench_tellers.tid, pgbench_tellers.tbalance, pgbench_tellers.bid
                     Inner Unique: true
                     Hash Cond: ((h.bid = pgbench_tellers.bid) AND (h.tid = pgbench_tellers.tid))
                     Buffers: shared hit=4570
                     Worker 0:  actual time=13.074..65.149 rows=487 loops=1
                       Buffers: shared hit=1840
                     ->  Parallel Seq Scan on public.pgbench_history h  (cost=0.00..6791.32 rows=122995 width=16) (actual time=25.390..58.399 rows=104537 loops=2)
                           Output: h.tid, h.bid, h.aid, h.delta, h.mtime, h.filler
                           Filter: ((h.mtime > '2024-08-27 09:43:00'::timestamp without time zone) AND (h.mtime < '2024-08-27 09:44:00'::timestamp without time zone))
                           Rows Removed by Filter: 118691
                           Buffers: shared hit=2852
                           Worker 0:  actual time=7.789..41.679 rows=100852 loops=1
                             Buffers: shared hit=972
                     ->  Hash  (cost=862.50..862.50 rows=484 width=12) (actual time=4.452..4.452 rows=489 loops=2)
                           Output: pgbench_tellers.tid, pgbench_tellers.tbalance, pgbench_tellers.bid
                           Buckets: 1024  Batches: 1  Memory Usage: 30kB
                           Buffers: shared hit=1700
                           Worker 0:  actual time=4.387..4.388 rows=489 loops=1
                             Buffers: shared hit=850
                           ->  Seq Scan on public.pgbench_tellers  (cost=0.00..862.50 rows=484 width=12) (actual time=2.599..4.221 rows=489 loops=2)
                                 Output: pgbench_tellers.tid, pgbench_tellers.tbalance, pgbench_tellers.bid
                                 Filter: (pgbench_tellers.tbalance < 0)
                                 Rows Removed by Filter: 511
                                 Buffers: shared hit=1700
                                 Worker 0:  actual time=2.547..4.142 rows=489 loops=1
                                   Buffers: shared hit=850
               ->  Memoize  (cost=0.28..0.31 rows=1 width=8) (actual time=0.002..0.002 rows=1 loops=965)
                     Output: pgbench_branches.bid, pgbench_branches.bbalance
                     Cache Key: h.bid
                     Cache Mode: logical
                     Hits: 379  Misses: 99  Evictions: 0  Overflows: 0  Memory Usage: 9kB
                     Buffers: shared hit=586
                     Worker 0:  actual time=0.002..0.002 rows=1 loops=487
                       Hits: 391  Misses: 96  Evictions: 0  Overflows: 0  Memory Usage: 9kB
                       Buffers: shared hit=289
                     ->  Index Scan using pgbench_branches_pkey on public.pgbench_branches  (cost=0.27..0.30 rows=1 width=8) (actual time=0.004..0.004 rows=1 loops=195)
                           Output: pgbench_branches.bid, pgbench_branches.bbalance
                           Index Cond: (pgbench_branches.bid = h.bid)
                           Filter: (pgbench_branches.bbalance < 0)
                           Rows Removed by Filter: 0
                           Buffers: shared hit=586
                           Worker 0:  actual time=0.004..0.004 rows=1 loops=96
                             Buffers: shared hit=289
         ->  Index Only Scan using pgbench_accounts_pkey on public.pgbench_accounts a  (cost=0.43..3.45 rows=1 width=4) (actual time=0.023..0.023 rows=1 loops=498)
               Output: a.aid
               Index Cond: (a.aid = h.aid)
               Heap Fetches: 498
               Buffers: shared hit=2406
               Worker 0:  actual time=0.026..0.026 rows=1 loops=246
                 Buffers: shared hit=1187
 Planning:
   Buffers: shared hit=28
 Planning Time: 3.674 ms
 Execution Time: 112.478 ms
(73 rows)
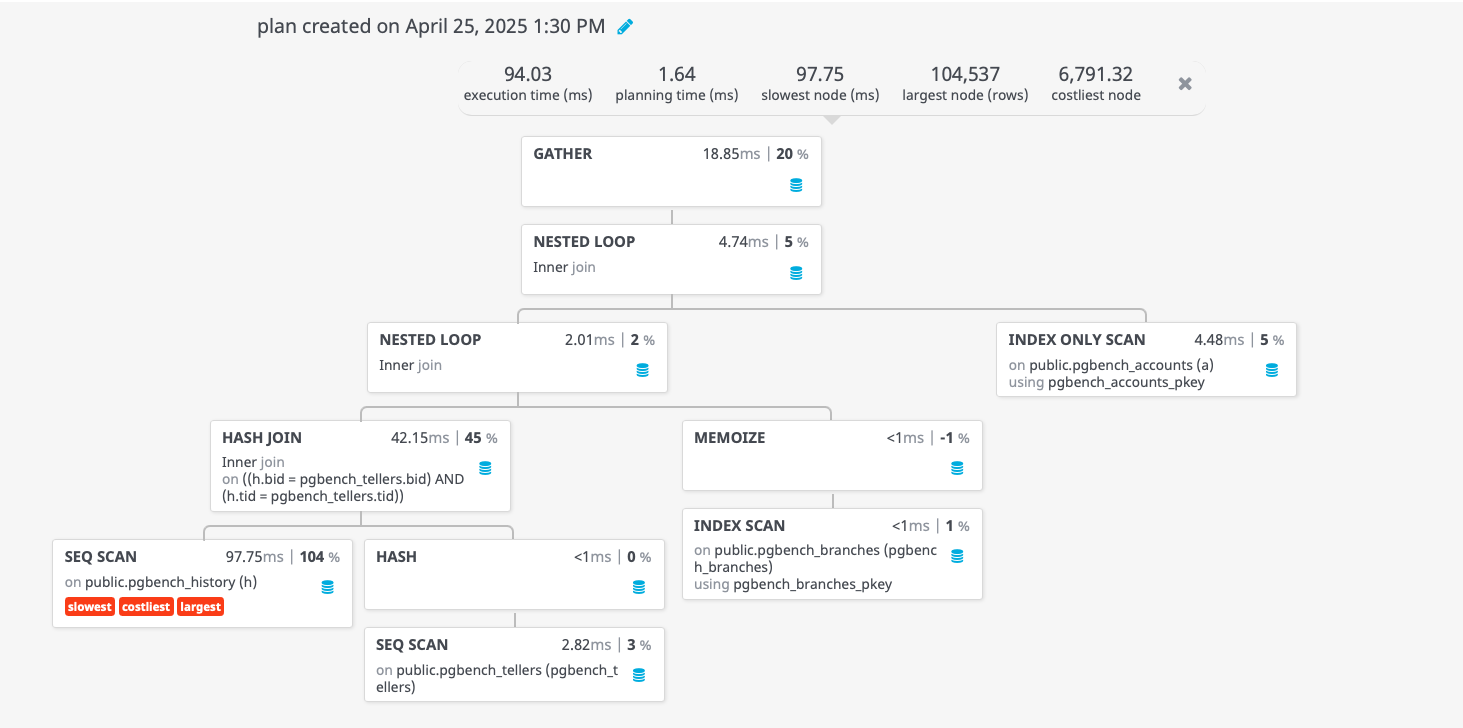
Notice that the slowest part of the query is now scanning pgbench_history, which is a much smaller (both in number of rows and width), while the scanning of pgbench_accounts is now a super-fast Index Only Scan on the primary key.
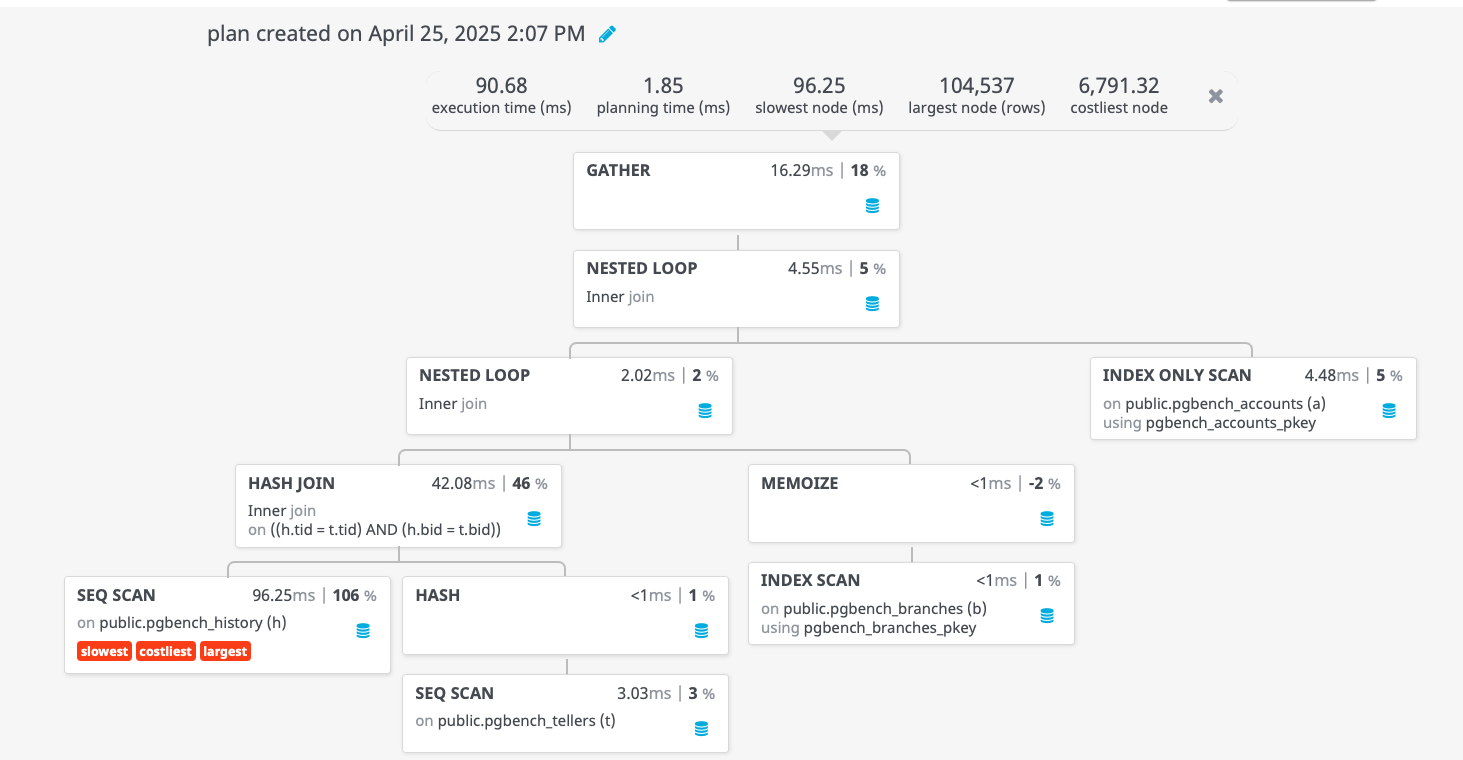
Finally, we can rewrite the query as follows and get the same costs from our explain plan (the column width is because we have the redundant column h.aid in the version above):
SELECT a.aid, b.bid, t.tid, h.delta, b.bbalance, t.tbalance
FROM pgbench_accounts a
JOIN pgbench_history h ON (a.aid = h.aid)
JOIN pgbench_branches b ON (h.bid = h.bid)
JOIN pgbench_tellers t ON (h.tid = t.tid AND h.bid = t.bid AND b.bid = t.bid)
WHERE b.bbalance < 0
AND t.tbalance < 0
AND h.mtime > '2024-08-27 09:43:00' AND h.mtime < '2024-08-27 09:44:00'

 Gather  (cost=1870.47..10469.49 rows=526 width=24) (actual time=59.218..123.402 rows=498 loops=1)
   Output: a.aid, b.bid, t.tid, h.delta, b.bbalance, t.tbalance
   Workers Planned: 1
   Workers Launched: 1
   Buffers: shared hit=7571
   ->  Nested Loop  (cost=870.47..9416.89 rows=309 width=24) (actual time=38.762..97.642 rows=249 loops=2)
         Output: a.aid, b.bid, t.tid, h.delta, b.bbalance, t.tbalance
         Inner Unique: true
         Buffers: shared hit=7571
         Worker 0:  actual time=21.383..79.899 rows=263 loops=1
           Buffers: shared hit=3425
         ->  Nested Loop  (cost=870.04..8351.55 rows=309 width=24) (actual time=38.575..92.001 rows=249 loops=2)
               Output: h.delta, h.aid, b.bid, b.bbalance, t.tid, t.tbalance
               Inner Unique: true
               Buffers: shared hit=5159
               Worker 0:  actual time=21.175..73.247 rows=263 loops=1
                 Buffers: shared hit=2145
               ->  Hash Join  (cost=869.76..8306.81 rows=595 width=24) (actual time=38.184..90.762 rows=482 loops=2)
                     Output: h.delta, h.aid, h.bid, t.tid, t.tbalance, t.bid
                     Inner Unique: true
                     Hash Cond: ((h.tid = t.tid) AND (h.bid = t.bid))
                     Buffers: shared hit=4570
                     Worker 0:  actual time=20.651..71.808 rows=503 loops=1
                       Buffers: shared hit=1850
                     ->  Parallel Seq Scan on public.pgbench_history h  (cost=0.00..6791.32 rows=122995 width=16) (actual time=28.927..63.086 rows=104537 loops=2)
                           Output: h.tid, h.bid, h.aid, h.delta, h.mtime, h.filler
                           Filter: ((h.bid IS NOT NULL) AND (h.mtime > '2024-08-27 09:43:00'::timestamp without time zone) AND (h.mtime < '2024-08-27 09:44:00'::timestamp without time zone))
                           Rows Removed by Filter: 118691
                           Buffers: shared hit=2852
                           Worker 0:  actual time=11.020..45.620 rows=101822 loops=1
                             Buffers: shared hit=982
                     ->  Hash  (cost=862.50..862.50 rows=484 width=12) (actual time=8.654..8.654 rows=489 loops=2)
                           Output: t.tid, t.tbalance, t.bid
                           Buckets: 1024  Batches: 1  Memory Usage: 30kB
                           Buffers: shared hit=1700
                           Worker 0:  actual time=8.622..8.622 rows=489 loops=1
                             Buffers: shared hit=850
                           ->  Seq Scan on public.pgbench_tellers t  (cost=0.00..862.50 rows=484 width=12) (actual time=2.503..8.117 rows=489 loops=2)
                                 Output: t.tid, t.tbalance, t.bid
                                 Filter: (t.tbalance < 0)
                                 Rows Removed by Filter: 511
                                 Buffers: shared hit=1700
                                 Worker 0:  actual time=2.476..8.072 rows=489 loops=1
                                   Buffers: shared hit=850
               ->  Memoize  (cost=0.28..0.31 rows=1 width=8) (actual time=0.002..0.002 rows=1 loops=965)
                     Output: b.bid, b.bbalance
                     Cache Key: h.bid
                     Cache Mode: logical
                     Hits: 364  Misses: 98  Evictions: 0  Overflows: 0  Memory Usage: 9kB
                     Buffers: shared hit=589
                     Worker 0:  actual time=0.002..0.002 rows=1 loops=503
                       Hits: 405  Misses: 98  Evictions: 0  Overflows: 0  Memory Usage: 9kB
                       Buffers: shared hit=295
                     ->  Index Scan using pgbench_branches_pkey on public.pgbench_branches b  (cost=0.27..0.30 rows=1 width=8) (actual time=0.006..0.006 rows=1 loops=196)
                           Output: b.bid, b.bbalance
                           Index Cond: (b.bid = h.bid)
                           Filter: (b.bbalance < 0)
                           Rows Removed by Filter: 0
                           Buffers: shared hit=589
                           Worker 0:  actual time=0.006..0.006 rows=1 loops=98
                             Buffers: shared hit=295
         ->  Index Only Scan using pgbench_accounts_pkey on public.pgbench_accounts a  (cost=0.43..3.45 rows=1 width=4) (actual time=0.022..0.022 rows=1 loops=498)
               Output: a.aid
               Index Cond: (a.aid = h.aid)
               Heap Fetches: 498
               Buffers: shared hit=2412
               Worker 0:  actual time=0.025..0.025 rows=1 loops=263
                 Buffers: shared hit=1280
 Planning:
   Buffers: shared hit=28
 Planning Time: 11.099 ms
 Execution Time: 125.216 ms
(72 rows)
The rewrite is strictly optional at this stage, the CTE version works just as well and can be simpler to diagnose if anything changes.
Summary
In this post, we covered:
- some examples of how you might rewrite a query
- how visualising a query can make identifying problems easier